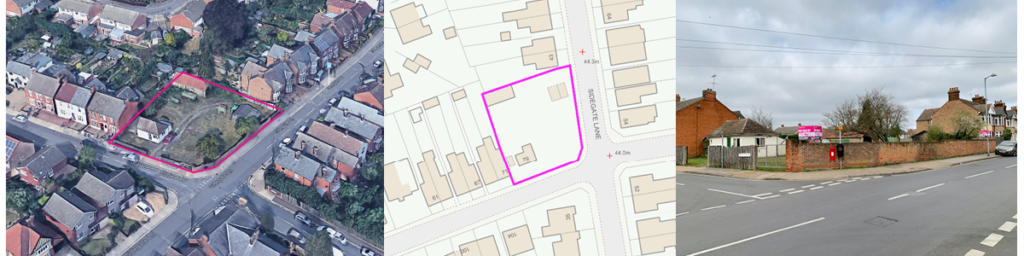
Address: 73 – 79 Hutland Road, Ipswich IP4 4HQ
Guide Price: £450,000 plus
Tenure: Freehold
Open Viewing: By appointment with the Auctioneers
Solicitor: Mr Edward Thomson
Kerseys Solicitors
32 Lloyds Avenue
Ipswich
IP1 3HQ
Lot number: TBA
Address: 73 – 79 Hutland Road, Ipswich IP4 4HQ
Guide Price: £450,000 plus
Tenure: Freehold
Open Viewing: By appointment with the Auctioneers
Solicitor: Mr Edward Thomson
Kerseys Solicitors
32 Lloyds Avenue
Ipswich
IP1 3HQ
The London Economic has ranked Ipswich among the top 10 up-and-coming places to live in the UK being acknowledged for its affordable house prices and convenient proximity to London, earning 7th place in a recent analysis
Being ideally positioned for both the city and Suffolk coast, Ipswich is noted as having received a “huge injection of investment” and is going from strength-to-strength with the Government striving to attract high-tech industries to the locality.
Rightmove statistics for 2017 report average Ipswich selling figures: semi-detached properties being the most popular reaching £217,693 terraced residences achieving £178,039 and flats coming in at £125,979. This cements Ipswich as an affordable area for families to set up home.
In summary, Ipswich’s overall average property price of £211,045 is considerably below the national average and massively less than London with prices rising to £736,000. Sold prices in Ipswich have grown by 5% compared with the previous year and are 13% up on the year prior to that, identifying Suffolk’s county town as a strong place for investors.
The full article can be read here.
Recent data and research by the Halifax using its own house price index shows the average price for a UK flat has grown by 53% over the last 7 years compared to 39% against all other property types.
Terraced houses show the next biggest gain recording an average rise of 43% followed by semi-detached homes with their combined popularity both realising 60% of all home sales in 2016.
The Halifax reports that outside of London, flats are currently the most affordable property type in the UK averaging £167,144, followed by terraced homes at £185,166.
On average, flats in the North cost £116,855, followed by Yorkshire and the Humber at £124,734 with the East Midlands coming in at £123,561. The lowest, affordable property type in London is a flat. In fact, the average price of a flat in London is £398,038, which is £230,894 greater when looking at the rest of the UK at £167,144.
A full summary of the key points, facts and figures from can be found on Property Wire, click here to read more.
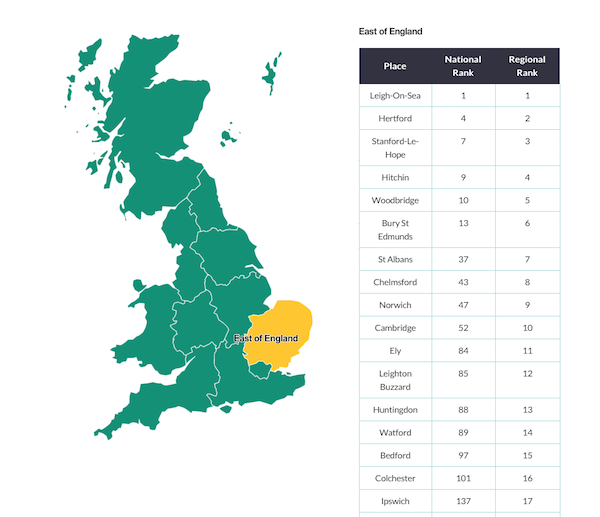
A national Rightmove survey of nearly 24,000 participants has placed a Suffolk and Norfolk town in the top 10 of the UK’s happiest places to live.
The survey, which set out 12 factors ranging from friendliness of the neighbours to provision of local services ranked Woodbridge 10th happiest and Leigh-on-Sea as the UK’s number one happiest place to reside.
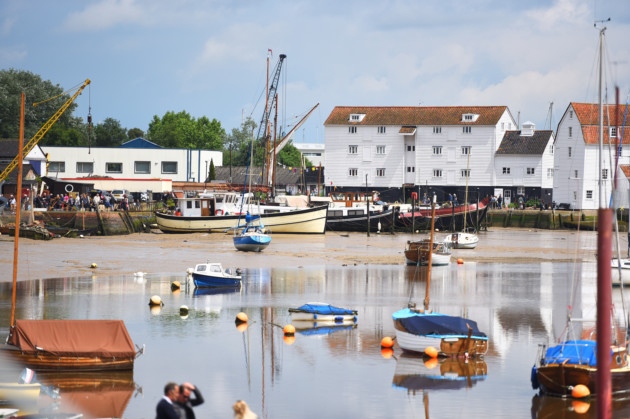
The Ipswich Star interviewed the Mayor of Woodbridge Stephen Attwell, who commented that he “wasn’t surprised” by the results. With its fascinating selection of historic and contemporary buildings combined with amazing views across the River Deben, he said:
“It’s a very safe town with a low crime rate, has a good range of shops and facilities and is well-placed for visiting the sea and cultural places like Aldeburgh – it’s a very attractive place to live.”
Woodbridge also scored highly under the section “I can be myself”, which saw the town rank 2 out of 206.
Overall, the next highest-ranking town in Suffolk and North Essex was Bury St Edmunds, which came in at a credible 13th.
Congratulations to Leigh-on-Sea who secured the top spot. The Independent covered this story and highlighted its “real village feel”, community spirit, range of independent shops and that the town was “really buzzing”.
Rightmove’s interactive survey results are here.
Click here for the Ipswich Star article and here for coverage from the Independent.
In its most recent House Price Index, Nationwide has disclosed that UK house prices are rising up against the so-called doom-and-gloom of Brexit. A monthly 0.6% increase for August 2016 added to annual growth edging up prices from 5.2% to 5.6% with the UK average reaching £206,145.
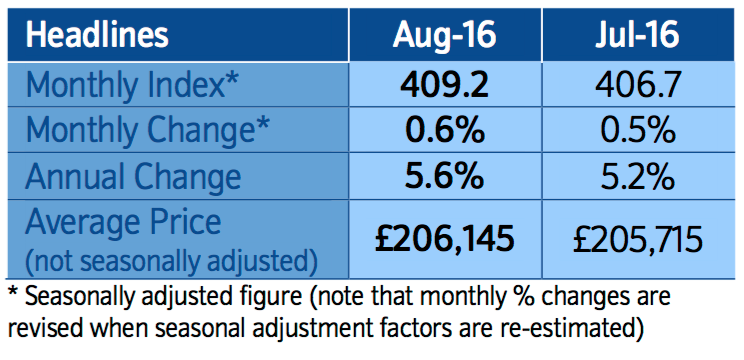
Nationwide Chief Economist, Robert Gardner, suggested that prospects for the UK’s housing market were still uncertain:
“The pick-up in price growth is somewhat at odds with signs that housing market activity has slowed in recent months. “New buyer enquiries have softened as a result of the introduction of additional Stamp Duty on second homes in April and the uncertainty surrounding the EU referendum. The number of mortgages approved for house purchase fell to an 18-month low in July.
“However, the decline in demand appears to have been matched by weakness on the supply side of the market. Surveyors report that instructions to sell have also declined and the stock of properties on the market remains close to 30-year lows. This helps to explain why the pace of house price growth has remained broadly stable.”
Adding that the future for the housing market was not transparent, he said: “What happens next on the demand side will be determined, to a large extent, by the outlook for the labour market and confidence amongst prospective buyers.”
The latest Nationwide House Price Index headlines can be read here.
The latest report from Nationwide reveals that average UK house prices increased by 0.8% compared with March, reaching a barrier-breaking £200,251 and annual house price inflation of 5.7%.
Nationwide’s Chief Economist, Robert Gardner commented:
“There has been a pickup in housing market activity in recent months, with the number of housing transactions and mortgage approvals rising strongly. “This is likely to have been driven, at least in part, by changes to Stamp Duty on second homes, where buyers have brought forward purchases in order to avoid the additional tax liabilities.
“The pace of house price growth may moderate again. However, it is possible that the recent pattern of strong employment growth, rising real earnings, low borrowing costs and constrained supply will keep the demand/supply balance tilted in favour of sellers and maintain pressure on price growth in the quarters ahead.”
Other property experts are debating this news and are uncertain whether prices will carry on rising or dip marginally following the Stamp Duty stampede.
In addition, the new Stamp Duty levy could affect buyers of homes containing ‘granny annexes’, as reported by the Telegraph, with predictions of a 3% knock-on effect in values…the Treasury said only 0.1% of transactions would be hit.
Click here for Nationwide’s House Price Index.
The Telegraph reports here.
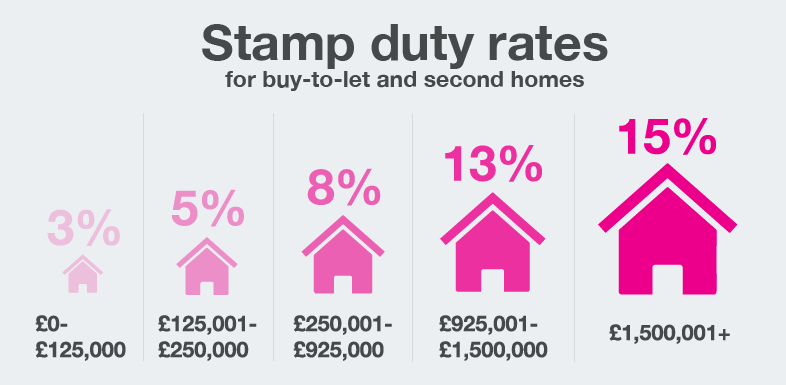
How much extra will buyers have to pay?
Try our handy Stamp Duty Calculator… click the form below to be redirected or follow http://www.goldingsauctions.co.uk/stamp-duty-calculator to find out how much tax is payable.
Source : HMRC
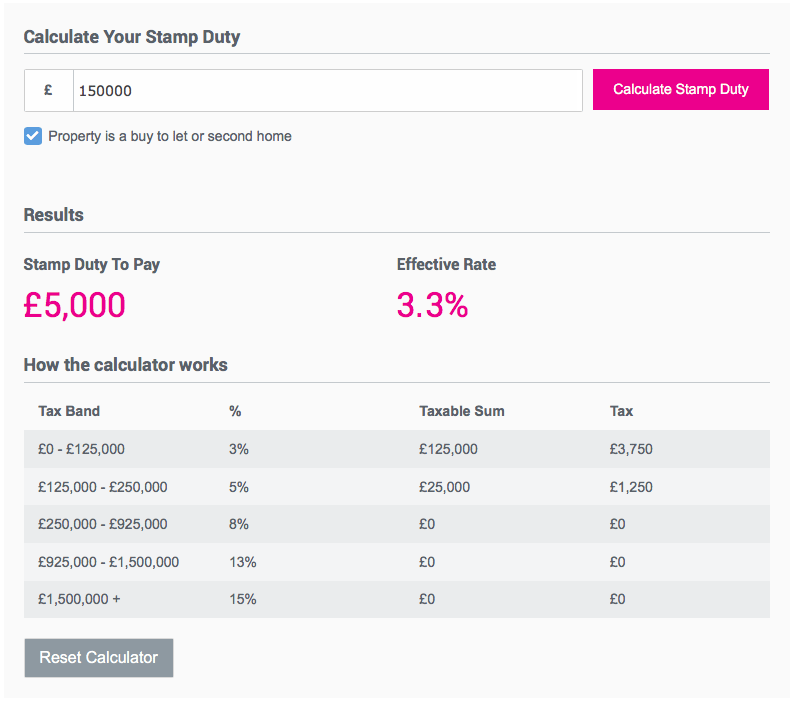
If you purchased a property for £150,000 you would incur 3% stamp duty up to the first £125,000, followed by 5% on £125,000 to £250,000 (e.g.: 3% of £125,000 + 5% on the £25,000 difference = £3,750 + £1,250 = £5,000 SDLT to pay). As the value of the property increases, the amount due increases in line with a specific tax bracket, the percentages increasing once a higher tier value is established.
Stamp Duty charges must be settled with HMRC 30 days from the property transaction completion date, or you may risk being fined. Your solicitor or legal adviser should take ownership of this for you to make certain the deadline is not missed. Certain buyers opt to add on the SDLT figure to their mortgage loan. We recommend that you always seek further advice from your mortgage lender.
Stamp Duty is incurred by everyone purchasing a freehold, leasehold or shared ownership residential property that exceeds £125,000 in England, Northern Ireland and Wales (other rules apply to Land and Buildings Transactions Tax in Scotland), if it’s a property used as a primary residence and with no minimum if the property or land is a second home/investment. These regulations also apply to overseas buyers.
Stamp Duty increases have hurt the luxury end of the London housing market, with buyers rushing to East Anglia instead to avoid our capital’s rising costs – growth in the city has stalled for the fourth month in a row.
Such an impact has had a positive effect on East Anglia, with the value of properties rising faster than those in London. The Telegraph reports recent findings by the Royal Institute of Chartered Surveyors (RICS) reveal price growth in London’s prime areas has faltered due to Stamp Duty increases – 10% for homes of £1m+ increasing to 12% for houses over £1.5m. An on-going lack of stock has also been highlighted as a reason for property prices continuing to rise.
The monthly report commissioned by Chartered Surveyors operating in the sales and letting markets across the UK shows 67% of respondents awarding the largest increase in property prices to East Anglia, followed by the South East and the East Midlands.
In last month’s half-yearly budget statement, Finance Minister George Osborne announced planned subsidies for builders to develop 200,000 new homes over the course of the next 5 years, at 20% below market value.
RICS commented that this news has given reason for its members to forecast the largest increase in sales in over 2 years, which they say will ultimately give rise to higher prices rather than further construction.
The Telegraph article can be read here and click here to access the RICS website with its wealth of information and current news on all things property-related.
The largest increase in house prices after London and the South East has been realised in East Anglia.
Latest figures released by The Lloyds Bank Homemovers Review highlight the average price paid by home movers in the first half of 2015 together with a percentage price comparison from 2005 to 2015.
The biggest gain was reported in London, whereas Wales and the North West saw the smallest increase. The only place in the UK where prices dropped was Northern Ireland.